In
A3716 16+ Channel Online Monitoring System
☰
filters
A3716 16+ Channel Online Monitoring System
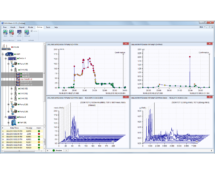
The A3716 is powerful online monitoring system for rotating machinery. The A3716 system can operate as an independent monitoring system or it can be used as extension of an existing protection system. The A3716 module contains 16 AC, 16 DC and 4 TACHO inputs. All channels are measured simultaneously. The A3716 modules can be easily composed together and by this we can create system with more channels. The setting and control of A3716 is done in DDS software. The setting has never been easier. The only thing you need to do is to create the tree of machines, measurement points,required readings and assign them to appropriate channels. Then you just press START and the readings are done automatically.Key Features:
- Adaptive algorithm of data acquisition
- 16 channels AC (ICP®)
- 16 channels DC
- 4 TACHO inputs
- 16 BNC buffered outputs of signals from sensors
- 16 programmable relays outputs
Application Scheme of A3716 Units

| Technical Performance |
|---|
| Input channels AC: 16 x AC, ICP® power supply on/off input impedance 100kΩ integration single, double high pass filter 1 Hz – 12800 Hz low pass filter 25 Hz – 25600 Hz |
| Input channels DC: 16 x DC for process values input impedance 100 kΩ (VDC), 250 Ω (mADC) |
| TACHO inputs: 4 independent TACHO for speed probe / external trigger speed range 0,8 Hz – 1000 Hz |
| Input range: AC +/- 12 V peak-peak DC +/- 24 V or 4 – 20 mA TACHO +10V |
| AD conversion: 24 bit, 64 bit double floating point internal signal processing No AutoGain function! |
| Dynamic range S/N: 120 dB |
| Frequency ranges: max. 25,6 kHz (16 Ch, 65,5 kHz sampling) |
| Sampling mode: Fully simultaneous for 16 channels |
| FFT resolution: Min. 100 lines Max. 25 600 lines |
| Processor: Intel Core2 – 2.5 GHz |
| Memory RAM: 4 GB |
| Internal hard drive: SSD 128GB |
| Data acquisition: Overall values Time signals FFT real time analysis DEMOD – ENVELOPE analysis ACMT – low speed bearing analysis order analysis user band pass analysis RPM measurement DC measurement Orbit measurement Speed measurement |
| Signal Recorder: 64 kHz sampling frequency 4 Ch memory consumption 3 GB/hour |
| Trigger: free run, TACHO, external (voltage) |
| Communication: Ethernet 1GB RJ45 |
| Temperature range: -10˚C to +50˚C |
| Power: AC 110 – 240 V, 45 – 65 Hz |
| Case: 19´´aluminium rack |
| Size & Weight (2U): 430 x 360 x 90 mm 4,7 kg |
| Size & Weight (3U): 430 x 360 x 135 mm 6,2 kg |
Adaptive Algorithm of Data Acquisition
Conventional Model of Data Acquisition (used by various brands):
- Data was measured in defined time interval (e.g. every minute), so they were not measured continuously, so some important value changes in between those measurements have been lost
- Every measured data was saved, so the values with no information (same value as before) were saved and they took valuable space
Adaptive Algorithm of Data Acquisition (new Adash system):
- Data are measured continuously, so you cannot miss anything
- Only selected values are saved. If the measured value is not changing significantly, it is not saved. Adaptive Algorithm selects which data to save and which not.
How Adaptive Algorithm selects which data to save and which not?
- Adaptive Algorithm measures data continuously and it does not save the values which do not change significantly. It saves only those values which changes from the previous one more than e.g. 5%, so if the measured value does not change significantly, the system does not save it.
- Only selected values are saved. If the measured value is not changing significantly, it is not saved. Adaptive Algorithm selects which data to save and which not.
- There is time interval for data saving determined, so if this interval is set to 1 hour and a values do not change significantly for e.g. 1 hour, it is saved after 1 hour anyway).
- Adaptive Algorithm can change some of its parameters on its own, so the data saving is optimized, e.g. for the process with very variable values it can increase the percentage value of significant change (e.g. from 5% to 10%) determining which measured values are saved. See the picture below how it affects acquired results.
All data saved:

Significant change = 5 %

Significant change = 10 %

Significant change = 20 %

Significant change = 50 %


